Eudat indirect density map

The Eudat algorithm was designed while working for UbiEst around 2003-2004. It produces discrete population density maps indirectly from punctual data and nearby road graph analysis.
“Population density” information as provided from international vendors mostly comes in two forms: loose shapes (usually isolines) providing a rough population density for the area, or punctual data (usually related to cities as a whole) describing a density and maybe a radius.
Punctual data however can be reconstructed by using both existing data and road graphs from international GIS vendors such as NavTeq. The immediate advantage of such approach is very fine granularity (usually below 1 square kilometer) and quarterly updated content.
In eudat, the existing punctual data is first augmented by distributing the population count and position onto the real underlying road graph (using information such as civic numbers, road length, administrative status, etc). Then, punctual data is discretized, a statistical model is built and used to balance under-covered areas. This process brings the initial 190k to almost 1 million of samples just for the western Europe.
Unfortunately this method is still not perfect and shows several artifacts:
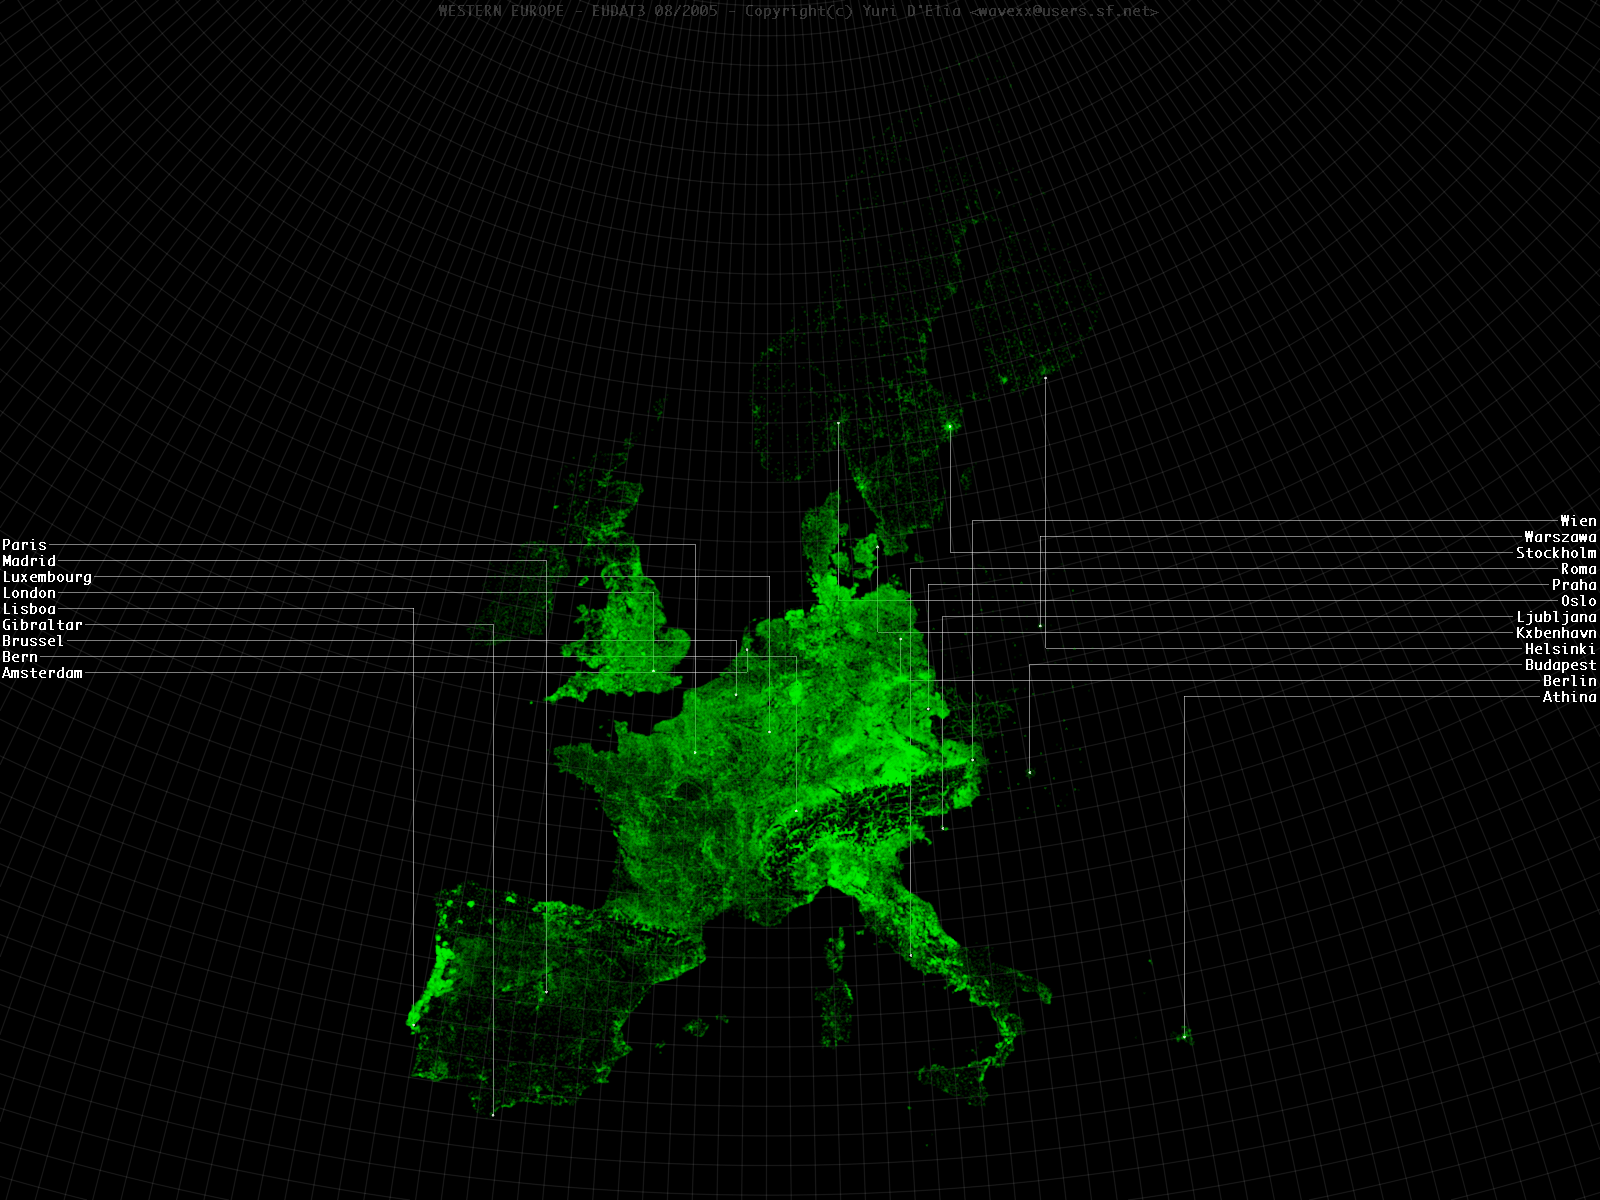
- Different countries have a different distribution topology that lead to density divergence. This can be especially seen in Portugal, appearing much denser than other countries.
- Augmenting data with road analysis is sometimes not sufficient for very wide metropolitan zones, as seen in Milan. The difference in road density between the old town centre and the industrial zone is creating an unrealistic distribution gap.
- Road analysis distribute the population nearby the graph, which is true manly for Italy, but not for other countries. Ghost tracks can be seen in low-covered areas in eastern zones.
Most of these issues could probably be worked around by keeping a manual list of adjustments to be made when the statistical model is applied, but doing so required too much manpower than what we had at the time. As such, the approach has been abandoned, leaving us with the pretty pictures.
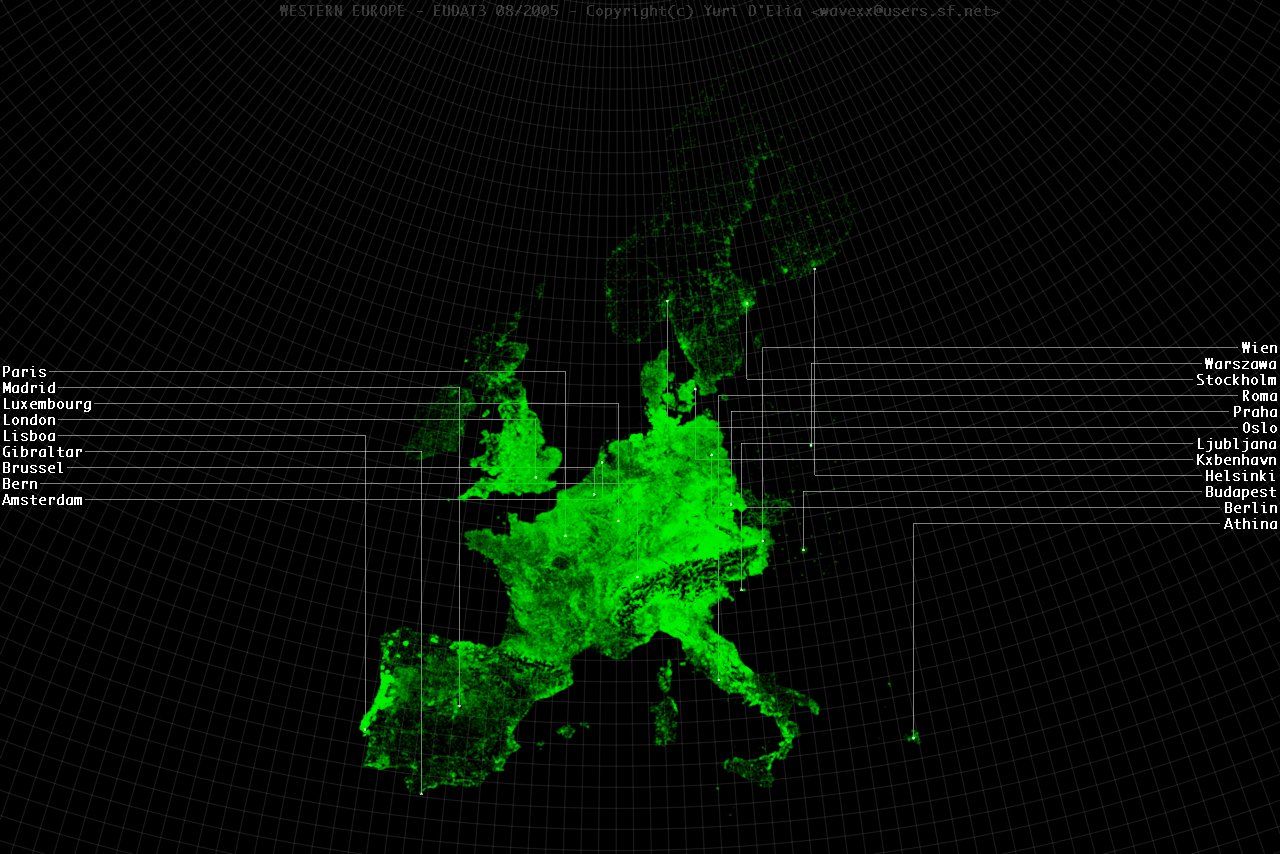
eudat3 images
The eudat3 render is a normalized plot of the final result over a Gauss conformal projection. The underlying grid shows real latitude and longitude degrees. The plot lacks accented letters.